Transformative culture
Table of Contents
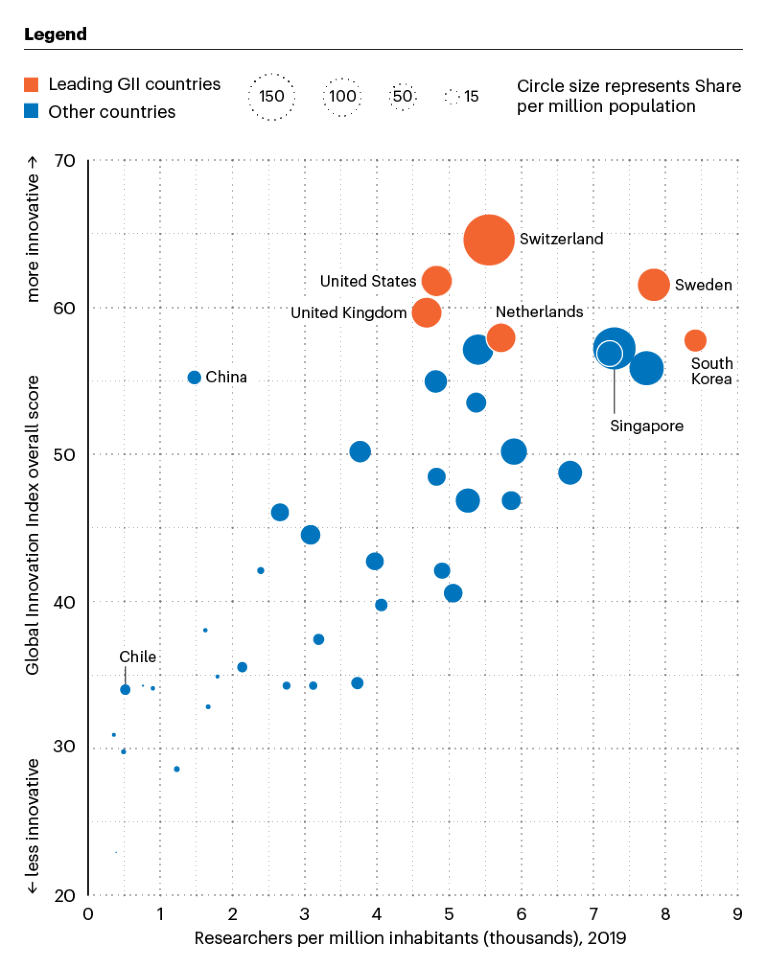
The chart below shows the relationship between overall scores obtained by each country/territory in the 2022 Global Innovation Index (GII) and the number of researchers per million people in that location (in 2019). Bubble size, meanwhile, shows the volume of research in the Nature Index (as measured by Share in 2021) relative to population size.
A few countries and territories have been marked out, including the top six nations by overall GII score, which are shaded in orange (for more information on these, see further charts below). Some other notable examples in the data are China, Singapore and Chile.
China has a high GII score but a low number of researchers per million (and low Share per million), suggesting it punches above its weight on innovation for its population size. Chile, meanwhile, manages to produce a relatively large amount of high-quality research despite low researcher density. Singapore’s bubble size reflects the large volume of Nature Index research it produces for its relatively small population. The two unlabelled bubbles closest to Singapore are Finland and Denmark, which, like Sweden, have some of the highest counts of researchers per million in the world.
Source: Nature Index, WIPO Global Innovation Index (2022), UNESCO, World Bank, The Lens. Data analysis by Bo Wu. Infographic by Simon Baker and Tanner Maxwell
World leaders
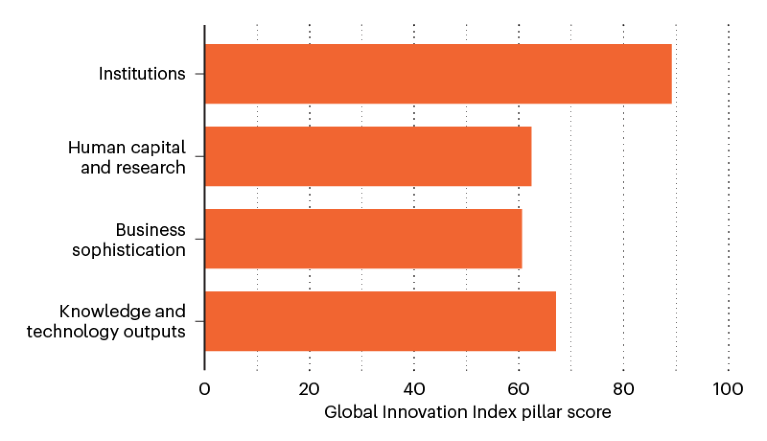
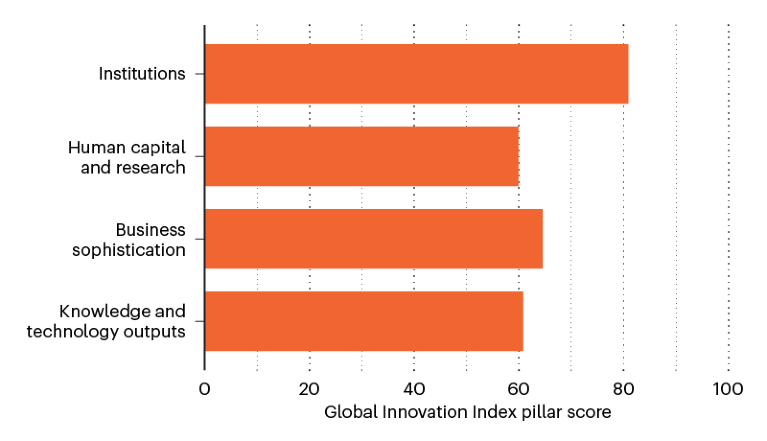
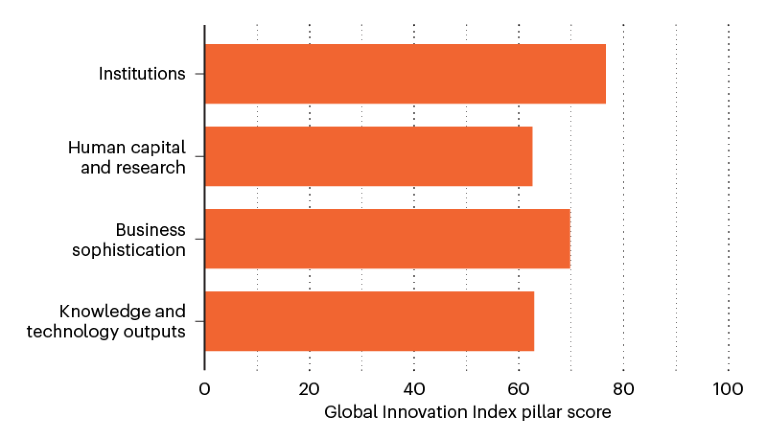
These charts show the six leading nations by overall GII score. Shown are their gross expenditure on research and development (GERD) as a percentage of GDP (2019); population size (2021) and the number of institutions in the top 100 ranked by ‘patent influence metric’ in this supplement. The bars show their separate scores in four areas — or ‘pillars’ — of innovation measured by the GII.
Switzerland
GERD as % of GDP: 3.15 | Population: 8.70 million | Institutions in top 100 of Innovation ranking: 5 | Top institution in Innovation ranking: F. Hoffmann-La Roche
Source: Nature Index, WIPO Global Innovation Index (2022), UNESCO, World Bank, The Lens. Data analysis by Bo Wu. Infographic by Simon Baker and Tanner Maxwell
United States
GERD as % of GDP: 3.17 | Population: 331.89 million | Institutions in top 100 of Innovation ranking: 61 | Top institution in Innovation ranking: Salk Institute for Biological Studies
Source: Nature Index, WIPO Global Innovation Index (2022), UNESCO, World Bank, The Lens. Data analysis by Bo Wu. Infographic by Simon Baker and Tanner Maxwell
Sweden
GERD as % of GDP: 3.39 | Population: 10.42 million | Institutions in top 100 of Innovation ranking: 1 | Top institution in Innovation ranking: Karolinska Institute
Source: Nature Index, WIPO Global Innovation Index (2022), UNESCO, World Bank, The Lens. Data analysis by Bo Wu. Infographic by Simon Baker and Tanner Maxwell
United Kingdom
GERD as % of GDP: 1.71 | Population: 67.33 million | Institutions in top 100 of Innovation ranking: 4 | Top institution in Innovation ranking: Wellcome Sanger Institute
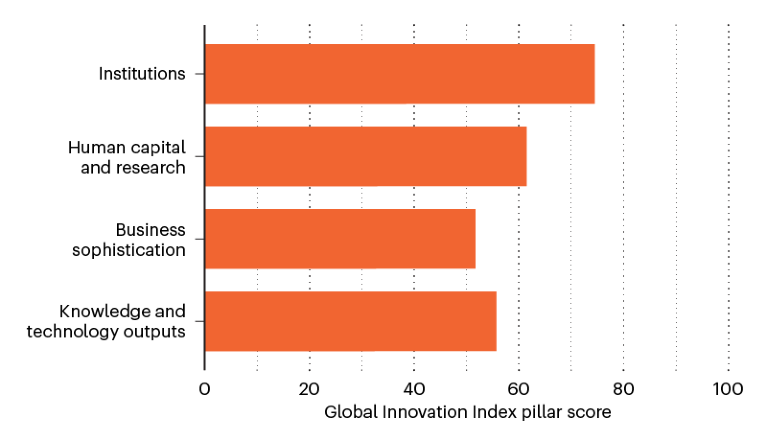
Source: Nature Index, WIPO Global Innovation Index (2022), UNESCO, World Bank, The Lens. Data analysis by Bo Wu. Infographic by Simon Baker and Tanner Maxwell
South Korea
GERD as % of GDP: 4.63 | Population: 51.74 million | Institutions in top 100 of Innovation ranking: 5 | Top institution in Innovation ranking: Korea Institute of Science and Technology
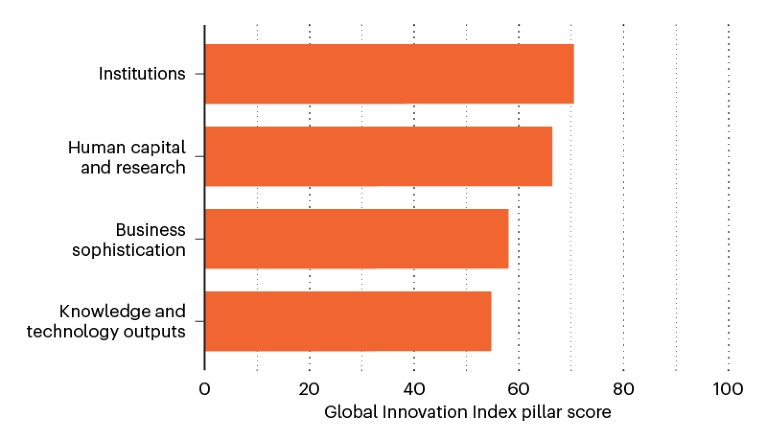
Source: Nature Index, WIPO Global Innovation Index (2022), UNESCO, World Bank, The Lens. Data analysis by Bo Wu. Infographic by Simon Baker and Tanner Maxwell
The Netherlands
GERD as % of GDP: 2.18 | Population: 17.53 million | Institutions in top 100 of Innovation ranking: 0 | Top institution in Innovation ranking: Eindhoven University of Technology
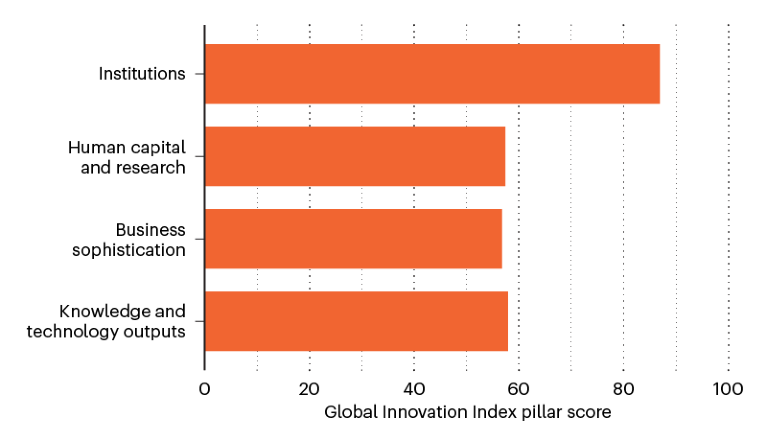
Source: Nature Index, WIPO Global Innovation Index (2022), UNESCO, World Bank, The Lens. Data analysis by Bo Wu. Infographic by Simon Baker and Tanner Maxwell
This article is part of Nature Index 2022 Innovation, an editorially independent supplement. Advertisers have no influence over the content.
